A Simple Dashboard for X Growth
A Simple Dashboard for X Growth
Native X analytics are overwhelming. Premium features are gated.
You need something simpler.
What you need is a simple dashboard with five metrics on one page that takes 15 minutes per week to maintain. Something that tells you what is working without creating another chore. The following sections explain how to build one.
Why Build Your Own Dashboard
Native 𝕏 analytics are limited. Full access requires 𝕏 Premium, the interface is cluttered and overwhelming, there is no historical trend visualization, and it does not highlight what matters for your goals.
A personal dashboard solves these problems. It shows only what you need, tracks trends over time, takes minutes to update, and costs nothing.
The Five Essential Metrics
Your dashboard needs exactly five metrics. More than this creates noise. Fewer misses important signals.
1. Engagement Rate
Why: Shows whether your content resonates with whoever sees it.
How to calculate: (Likes + Replies + Retweets + Quote Tweets) / Impressions × 100
Target: Above 1% is good. Above 2% is excellent. See detailed engagement benchmarks for your account size.
2. Profile Visits
Why: Shows whether people are curious enough about you to investigate.
How to track: Pull from X Analytics (available on mobile for individual posts, or via Premium dashboard).
Target: Trend upward over time.
3. Net Follower Growth
Why: Shows whether you're building an audience.
How to calculate: New Followers - Unfollows = Net Change
Target: Consistent positive growth. 2-5% monthly is healthy for established accounts.
4. Reply Rate
Why: Shows whether you're creating conversation, which the algorithm heavily rewards.
How to calculate: Replies Received / Impressions × 100
Target: Above 0.03% is healthy.
5. Top Post Analysis
Why: Reveals patterns in what works for YOUR account.
What to track: Your top 3 posts by engagement rate each week. Note format, topic, timing, and hook.
Building Your Dashboard: Three Options
Option 1: Google Sheets (Free, Recommended)
Create a spreadsheet with this structure:
Weekly Tracking Tab:
| Week | Engagement Rate | Profile Visits | Net Followers | Reply Rate | Posts Published |
|---|---|---|---|---|---|
| Jan 1 | 1.5% | 125 | +23 | 0.04% | 7 |
| Jan 8 | 1.8% | 142 | +31 | 0.05% | 8 |
| ... | ... | ... | ... | ... | ... |
Top Performers Tab:
| Week | Post Summary | Format | Topic | Time | Eng Rate | Why It Worked |
|---|---|---|---|---|---|---|
| Jan 1 | Thread on X algorithm | Thread | Growth | 9AM Tue | 3.2% | Timely, actionable |
| Jan 1 | Hot take on followers | Text | Growth | 12PM Wed | 2.8% | Contrarian hook |
| ... | ... | ... | ... | ... | ... | ... |
Add conditional formatting to highlight:
- Green: Above target
- Red: Below target
- Yellow: Meeting target
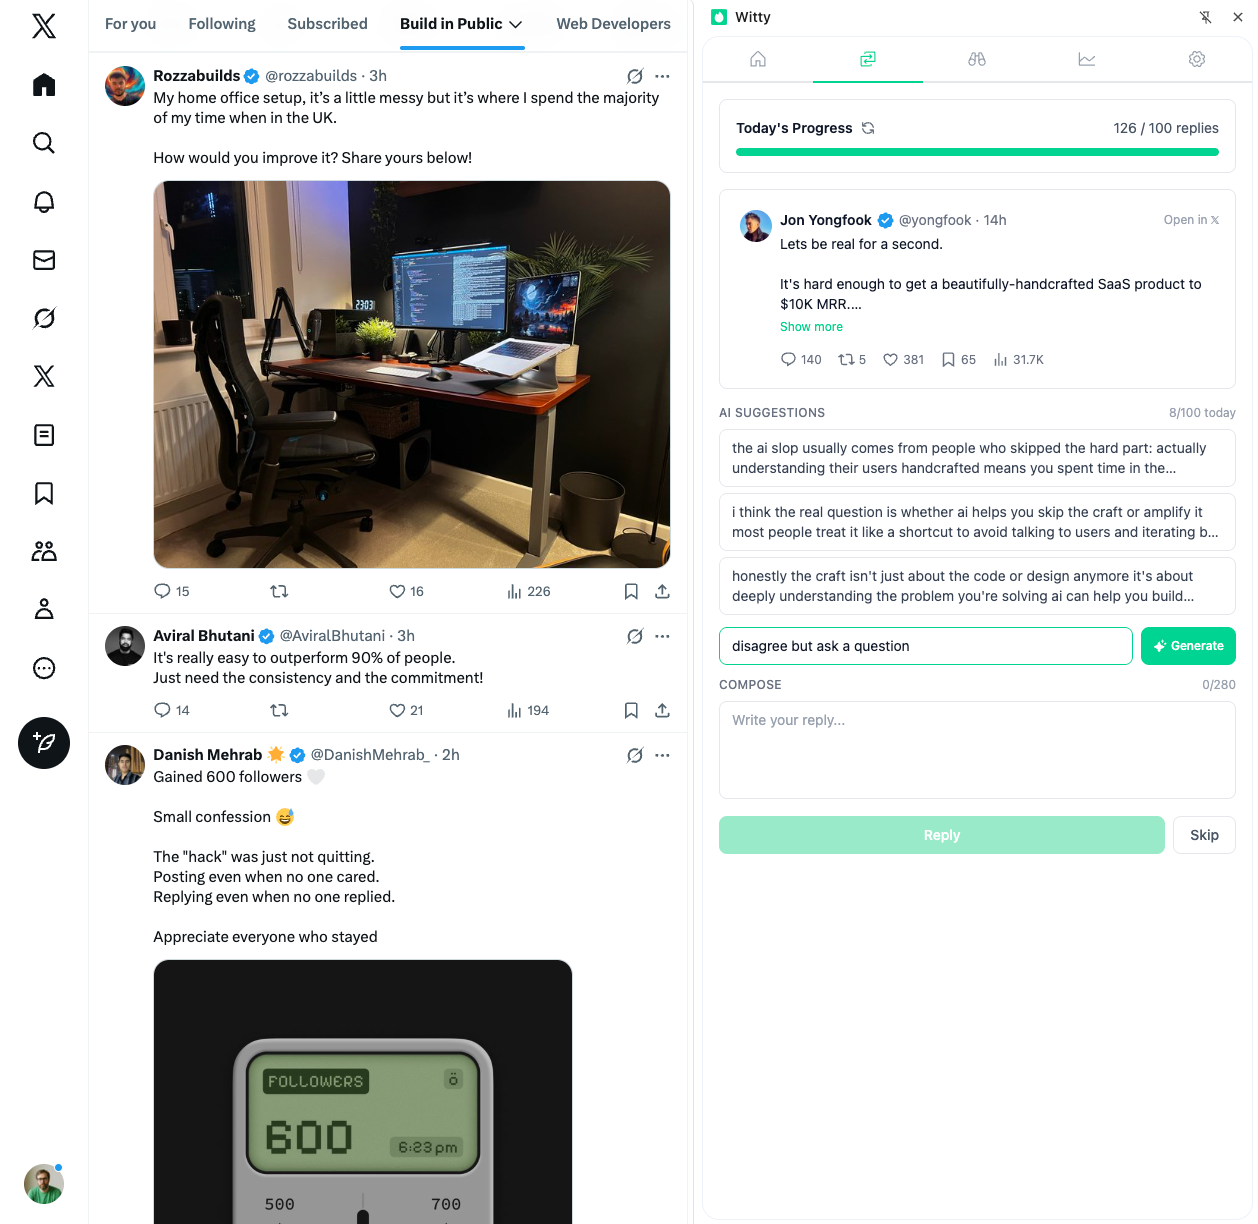
Option 2: Witty Chrome Extension
If you want analytics without manual tracking, Witty provides account analytics and post performance data in a clean interface. It tracks engagement metrics automatically and offers AI insights to help you understand what's working. The extension lives in your browser, so there's no separate app to manage.
Option 3: Notion Database (Free)
Create a database with properties:
- Week Start (Date)
- Engagement Rate (Number, %)
- Profile Visits (Number)
- Net Followers (Number)
- Reply Rate (Number, %)
- Posts Published (Number)
- Top Post 1 (Text)
- Top Post 2 (Text)
- Top Post 3 (Text)
- Weekly Insight (Text)
- Action Item (Text)
Views to create:
- Table view (for data entry)
- Chart view (for trends)
- Calendar view (for consistency tracking)
Option 4: Paper Journal (Simple)
Weekly entry format:
WEEK OF: __________

NUMBERS
├── Engagement Rate: ___% (↑/↓/→)
├── Profile Visits: ___ (↑/↓/→)
├── Net Followers: ___ (↑/↓/→)
└── Reply Rate: ___% (↑/↓/→)

TOP 3 POSTS
1. _______________
2. _______________
3. _______________

WHAT WORKED: _______________
WHAT DIDN'T: _______________
FOCUS NEXT WEEK: _______________
Paper works surprisingly well if digital feels like one more app to manage.
The Weekly Review Ritual
When: Same time each week
Sunday evening or Monday morning works best. Pick a time and protect it.
Duration: 15-20 minutes maximum
This isn't deep analysis. It's pattern recognition.
The Process
Spend minutes one through five gathering data by opening 𝕏 Analytics, noting impressions, engagements, profile visits, and follower change, and calculating engagement rate. Minutes six through ten go to updating your dashboard by entering this week's numbers, noting the trend arrows (up, down, or flat), and recording your top three performing posts. Minutes eleven through fifteen cover analysis and planning: identify patterns in top performers, note any warning signs in the trends, and determine one thing to try next week. Finally, minutes sixteen through twenty go to documenting insight by writing one sentence about what you learned and one action item for next week.
Reading Your Dashboard
Healthy Patterns
Good signs include engagement rate that is stable or improving, profile visits trending up, consistent net positive follower growth, reply rate steady or improving, and top posts with recognizable patterns. These indicate your content is resonating and your presence is growing.
Warning Signs
Concerning patterns include engagement declining three or more weeks in a row, profile visits dropping while impressions stay stable, net negative follower weeks, reply rate dropping toward zero, and no pattern in what works (randomness). These indicate something needs to change. Diagnose the cause.
Diagnostic Framework
| Symptom | Likely Cause | Action |
|---|---|---|
| High impressions, low engagement | Content isn't resonating | Improve hooks and value |
| High engagement, low profile visits | Content doesn't showcase you | Add personality, expertise |
| High visits, low follows | Profile isn't compelling | Optimize bio, pinned post |
| Everything declining | Visibility issue | Increase engagement activity |
Monthly Roll-Up
At the end of each month, add a summary entry:
MONTHLY SUMMARY - [MONTH]

GROWTH
├── Starting followers: ___
├── Ending followers: ___
├── Net growth: ___
└── Growth rate: ___%

ENGAGEMENT SUMMARY
├── Average engagement rate: ___%
├── Best week: ___%
├── Worst week: ___%
└── Trend: Improving / Stable / Declining

CONTENT INSIGHTS
├── Best format: ___
├── Best topic: ___
├── [Best posting time](/playbook/metrics-analytics/best-time-to-post): ___
└── Top post of month: ___

LESSONS LEARNED
1. ___
2. ___
3. ___
Monthly summaries reveal trends that weekly views miss.
Common Dashboard Mistakes
Adding 15 metrics "just in case" defeats the purpose. Five is enough. If you cannot explain why you are tracking something, remove it.
Building a beautiful dashboard and never looking at it is equally problematic. Schedule a recurring calendar event for weekly review and treat it as non-negotiable.
Checking the dashboard daily and feeling anxious about every fluctuation creates unnecessary stress. Once per week is sufficient. Daily numbers are noise.
Tracking diligently but never changing behavior based on what you learn wastes your effort. Every review must end with one action item. Small actions compound. For guidance on interpreting these numbers, see how to interpret metrics without obsessing.
Tools to Help (Optional)
If you want to automate some data collection, the Witty Chrome extension provides account and post analytics directly in your browser. It surfaces the metrics that matter without requiring you to build anything manually, and its AI insights can help identify patterns you might miss.
For those who prefer manual tracking, that works fine too and builds better intuition for what the numbers mean.
The Dashboard Philosophy
The best dashboard is one you actually use. Simple beats comprehensive, consistent beats perfect, action beats analysis, and trends beat snapshots. Your dashboard should take less time to maintain than a single good post takes to write. If it is consuming more energy than that, simplify.
Starting Today
This week, choose your format (Sheets, Notion, or paper), set up the template, enter last week's numbers if you can find them or start fresh, and schedule your first weekly review. Next week, complete your first review, identify one pattern, and take one action based on what you learned.
That is it. No subscriptions, no complex tools, no analysis paralysis. A simple dashboard, updated weekly, reveals everything you need to know about your 𝕏 growth. Build it, use it, and let the data guide you.
Related Articles

A Weekly Review Ritual for X Growth
Most people post, hope for engagement, and move on without looking back. That's not strategy. That's gambling. One practitioner turned 500 followers into 5,000 in six months by watching and acting on their data. A weekly review takes 30-60 minutes and compounds dramatically over time.
8 min read
The Minimalist Content Workflow for X
The average adult makes 35,000 decisions a day. Every time you sit down to post, you add more. Most workflows try to solve this by adding more tools and processes. The real solution is subtraction. A minimalist workflow eliminates unnecessary decisions while maintaining quality output.
7 min read
What to Do When Your Impressions Drop
Impressions down 40% from last week. Posts that used to get thousands now struggle for hundreds. First: don't panic. Second: don't immediately overhaul your strategy. Impressions naturally vary by 20-50% day-to-day. Here's how to diagnose what's actually happening and what to do about it.
6 min readYou've done the learning. Now put it into action.
Witty finds tweets worth replying to and helps you craft responses in seconds. Grow your audience without the grind.
No credit card required.